Weather forecast Playa Barca
The maximum temperature for Playa Barca in the coming week is 23℃, at Tuesday 7 May. The lowest temperature is 18℃, at Monday 13 May. Our Playa Barca weather forecast shows none precipitation the next 7 days at. The windiest day will be Sunday 12 May and can reach wind speeds of up to 34 km⁄h.
Weather forecast 14 days Playa Barca
Do you want to know what is the weather forecast for Playa Barca for the next 14 days? See what the weather will be like in Playa Barca for the next 2 weeks.
Wednesday 8 May
- Max: 21℃
- Min: 19℃
- Precipitation: 0mm
- Wind speed: 31km⁄h
Thursday 9 May
- Max: 21℃
- Min: 19℃
- Precipitation: 0mm
- Wind speed: 31km⁄h
Friday 10 May
- Max: 20℃
- Min: 19℃
- Precipitation: 0mm
- Wind speed: 30km⁄h
Saturday 11 May
- Max: 22℃
- Min: 19℃
- Precipitation: 0mm
- Wind speed: 30km⁄h
Sunday 12 May
- Max: 21℃
- Min: 19℃
- Precipitation: 0mm
- Wind speed: 34km⁄h
Monday 13 May
- Max: 21℃
- Min: 18℃
- Precipitation: 0mm
- Wind speed: 26km⁄h
Tuesday 14 May
- Max: 20℃
- Min: 19℃
- Precipitation: 0.1mm
- Wind speed: 31km⁄h
Wednesday 15 May
- Max: 20℃
- Min: 18℃
- Precipitation: 0mm
- Wind speed: 25km⁄h
Thursday 16 May
- Max: 20℃
- Min: 19℃
- Precipitation: 0mm
- Wind speed: 31km⁄h
Friday 17 May
- Max: 20℃
- Min: 18℃
- Precipitation: 0.1mm
- Wind speed: 34km⁄h
Saturday 18 May
- Max: 21℃
- Min: 19℃
- Precipitation: 0.1mm
- Wind speed: 34km⁄h
Sunday 19 May
- Max: 21℃
- Min: 18℃
- Precipitation: 0mm
- Wind speed: 34km⁄h
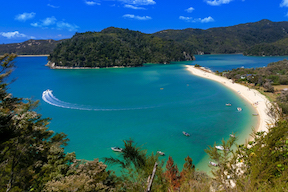
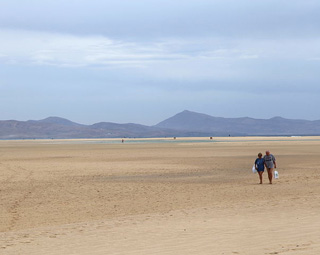
Playa Barca, Fuerteventura
 Source: Frank Vincentz, CC-BY-SA-3.0, Wikimedia Commons
Fuerteventura is a sunny, relatively uncrowded Canary Island with many beautiful white beaches and a brisk wind that allows for sports like windsurfing. More about Fuerteventura
Average temperature in Playa Barca (in ℃)
| Jan | Feb | Mar | Apr | May | Jun | Jul | Aug | Sep | Oct | Nov | Dec |
|---|---|---|---|---|---|---|---|---|---|---|---|
| 20 | 19 | 20 | 21 | 22 | 24 | 25 | 26 | 25 | 25 | 22 | 21 |
| 17 | 16 | 17 | 17 | 18 | 19 | 20 | 21 | 22 | 21 | 20 | 18 |
Average rainfall in Playa Barca (in millimeters)
| Jan | Feb | Mar | Apr | May | Jun | Jul | Aug | Sep | Oct | Nov | Dec |
|---|---|---|---|---|---|---|---|---|---|---|---|
| 5 | 6 | 6 | 3 | 2 | 0 | 0 | 1 | 9 | 12 | 10 | 5 |
Average number of wet days in Playa Barca
| Jan | Feb | Mar | Apr | May | Jun | Jul | Aug | Sep | Oct | Nov | Dec |
|---|---|---|---|---|---|---|---|---|---|---|---|
| 1 | 1 | 0 | 0 | 0 | 0 | 0 | 0 | 1 | 1 | 1 | 1 |

