
Weather forecast El Perelló
The maximum temperature for El Perelló in the coming week is 21℃, at Saturday 4 May. The lowest temperature is 13℃, at Friday 3 May. Our El Perelló weather forecast shows 7.3mm precipitation the next 7 days at. The windiest day will be Tuesday 7 May and can reach wind speeds of up to 34 km⁄h.
Weather forecast 14 days El Perelló
Do you want to know what is the weather forecast for El Perelló for the next 14 days? See what the weather will be like in El Perelló for the next 2 weeks.
Friday 3 May
- Max: 18℃
- Min: 13℃
- Precipitation: 0mm
- Wind speed: 22km⁄h
Saturday 4 May
- Max: 21℃
- Min: 15℃
- Precipitation: 0mm
- Wind speed: 21km⁄h
Sunday 5 May
- Max: 19℃
- Min: 15℃
- Precipitation: 1.7mm
- Wind speed: 17km⁄h
Monday 6 May
- Max: 21℃
- Min: 16℃
- Precipitation: 3.6mm
- Wind speed: 17km⁄h
Tuesday 7 May
- Max: 17℃
- Min: 15℃
- Precipitation: 2mm
- Wind speed: 34km⁄h
Wednesday 8 May
- Max: 20℃
- Min: 14℃
- Precipitation: 0mm
- Wind speed: 31km⁄h
Thursday 9 May
- Max: 21℃
- Min: 15℃
- Precipitation: 0mm
- Wind speed: 23km⁄h
Friday 10 May
- Max: 22℃
- Min: 16℃
- Precipitation: 0mm
- Wind speed: 22km⁄h
Saturday 11 May
- Max: 20℃
- Min: 16℃
- Precipitation: 0mm
- Wind speed: 28km⁄h
Sunday 12 May
- Max: 18℃
- Min: 15℃
- Precipitation: 0mm
- Wind speed: 19km⁄h
Monday 13 May
- Max: 18℃
- Min: 15℃
- Precipitation: 0.4mm
- Wind speed: 21km⁄h
Tuesday 14 May
- Max: 17℃
- Min: 16℃
- Precipitation: 3mm
- Wind speed: 31km⁄h
Wednesday 15 May
- Max: 18℃
- Min: 16℃
- Precipitation: 3.7mm
- Wind speed: 30km⁄h
El Perelló, Costa Dorada
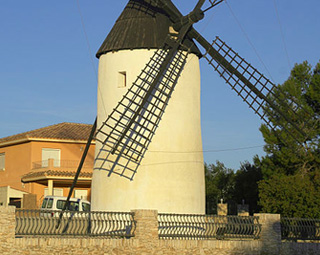 Source: Lycaon, CC-BY-SA-3.0, Wikimedia Commons
El Perelló is an inland village with few facilities in the south of the Costa Dorada. More about El Perelló
The Costa Dorada is a coastal strip that has many tourist facilities as well as cultural treasures. More about Costa Dorada
Average temperature in El Perelló (in ℃)
| Jan | Feb | Mar | Apr | May | Jun | Jul | Aug | Sep | Oct | Nov | Dec |
|---|---|---|---|---|---|---|---|---|---|---|---|
| 14 | 14 | 16 | 18 | 21 | 25 | 28 | 29 | 26 | 22 | 18 | 15 |
| 8 | 8 | 10 | 12 | 15 | 19 | 22 | 23 | 20 | 17 | 12 | 9 |
Average rainfall in El Perelló (in millimeters)
| Jan | Feb | Mar | Apr | May | Jun | Jul | Aug | Sep | Oct | Nov | Dec |
|---|---|---|---|---|---|---|---|---|---|---|---|
| 40 | 23 | 59 | 53 | 34 | 19 | 15 | 31 | 64 | 58 | 63 | 30 |
Average number of wet days in El Perelló
| Jan | Feb | Mar | Apr | May | Jun | Jul | Aug | Sep | Oct | Nov | Dec |
|---|---|---|---|---|---|---|---|---|---|---|---|
| 2 | 2 | 4 | 5 | 4 | 3 | 2 | 3 | 6 | 3 | 4 | 3 |

